Using Synthetic aperture radar and Google Earth Engine to identify ships
I have a certain fascination with oceans and vessels that get pushed through them. I was intrigued to find out that through Google Earth Engine one could get access to historic satellite captures all around the globe. Hearing about the ability to peer over the world, though clouds and night of synthetic aperture radars I was hooked. I had to build a program to identify ships from these captures. Here is the process I went through.
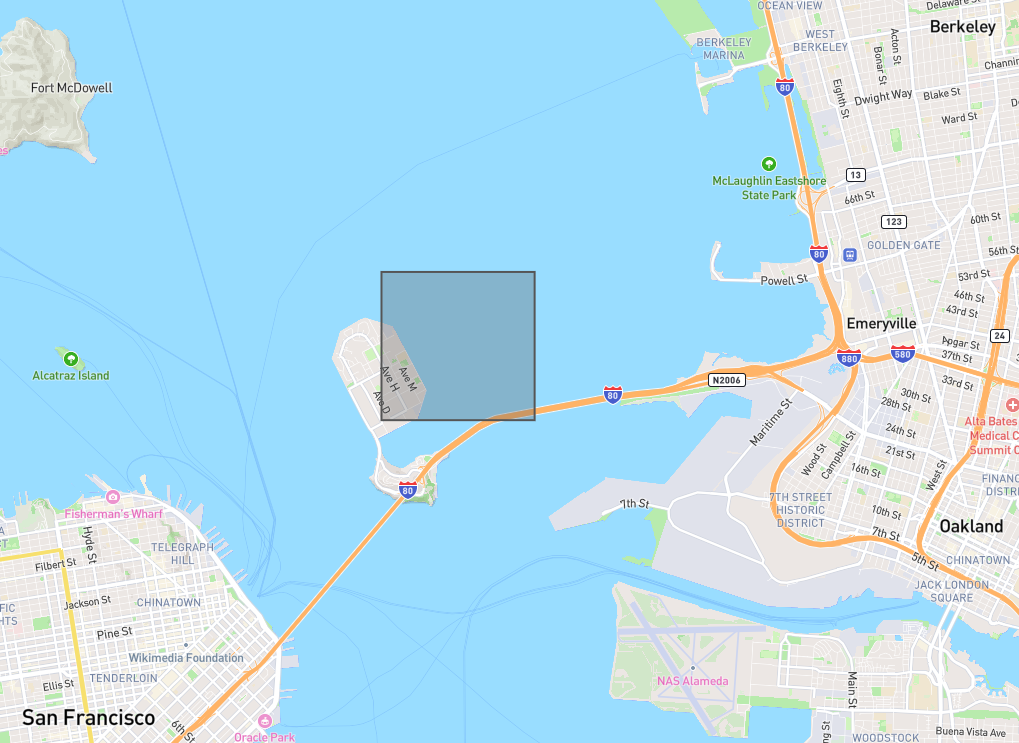
Initially one has to deide which area to focus their attention on. I decided to take a small snapshot of the San Franciso bay, since this is a quite active area and I was thus almost guaranteed to find ships within. Setting the bounds was performed using the following geoJSON object:
#tiny San Francisco
geoJSON = {
  "type": "FeatureCollection",
  "features": [
    {
      "type": "Feature",
      "properties": {},
      "geometry": {
        "coordinates": [
          [
            [
              -122.37060642482606,
              37.83824845055156
            ],
            [
              -122.37060642482606,
              37.818552848915076
            ],
            [
              -122.34483938880784,
              37.818552848915076
            ],
            [
              -122.34483938880784,
              37.83824845055156
            ],
            [
              -122.37060642482606,
              37.83824845055156
            ]
          ]
        ],
        "type": "Polygon"
      }
    }
  ]
}
Location visualized on https://geojson.io
With the following code one is able to obtain SAR (synthetic aperture radar) pictures from the Copernicus Satellite:
#https://developers.google.com/earth-engine/tutorials/community/detecting-changes-in-sentinel-1-imagery-pt-1
# Define a method for displaying Earth Engine image tiles to folium map.
def add_ee_layer(self, ee_image_object, vis_params, name):
  map_id_dict = ee.Image(ee_image_object).getMapId(vis_params)
  folium.raster_layers.TileLayer(
    tiles = map_id_dict['tile_fetcher'].url_format,
    attr = 'Map Data © <a href="https://earthengine.google.com/">Google Earth Engine</a>',
    name = name,
    overlay = True,
    control = True
  ).add_to(self)

# Add EE drawing method to folium.
folium.Map.add_ee_layer = add_ee_layer

coords = geoJSON['features'][0]['geometry']['coordinates']
aoi = ee.Geometry.Polygon(coords)

ffa_db = ee.Image(ee.ImageCollection('COPERNICUS/S1_GRD')
                       .filterBounds(aoi)
                       .filterDate(ee.Date('2020-08-01'), ee.Date('2020-08-31'))
                       #.filterDate(ee.Date('2020-01-01'), ee.Date('2020-01-10'))
                       .first()
                       .clip(aoi))
ffa_fl = ee.Image(ee.ImageCollection('COPERNICUS/S1_GRD_FLOAT')
                       .filterBounds(aoi)
                       .filterDate(ee.Date('2020-08-01'), ee.Date('2020-08-31'))
                       .first()
                       .clip(aoi))


url = ffa_db.select('VV').getThumbURL({'min': -20, 'max': 0})
disp.Image(url=url, width=800)
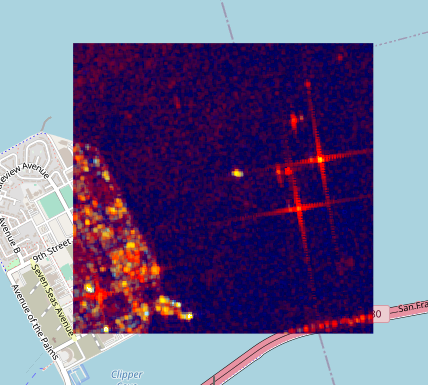
The result looks as follows:
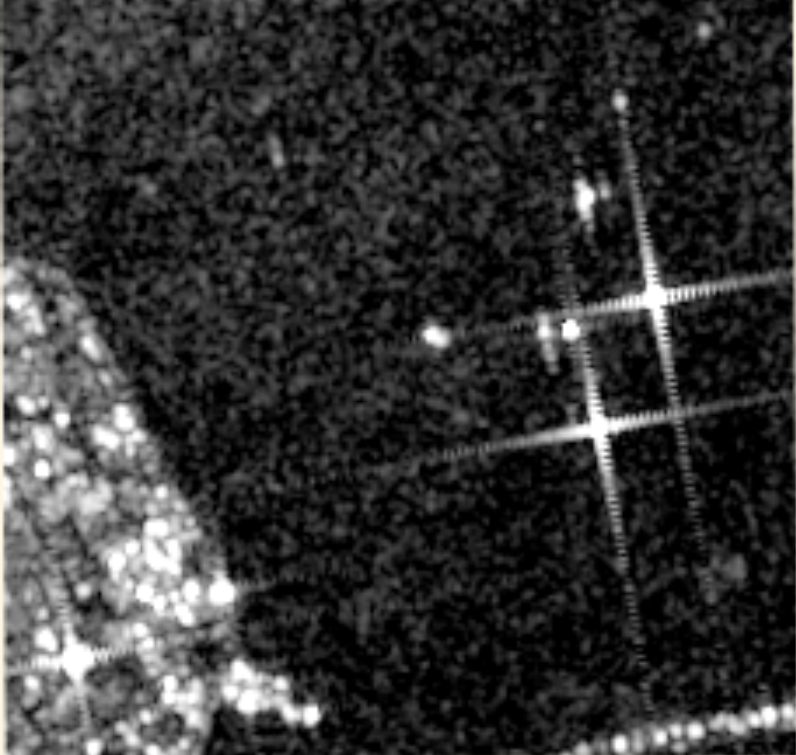
In this image we can observe the San-Francisco-Oakland Bay bridge on the bottom right, as well as treasure island on the left side. The blooms on the right side are ships anchored near the island. In this image we can see the necessity to mask out land features in our images. This will greatly simply the task of detecting ships.
The following code uses a mask already generated in another dataset. This was the most reliable I could find. We take this mask, and additionally expand it by a small threshold. This helps in removing areas with complex sea/land interactions and helps in obtaining more stable results.
#Water mask test
hansenImage = ee.Image('UMD/hansen/global_forest_change_2015');

# Select the land/water mask.
datamask = hansenImage.select('datamask');

# Create a binary mask.
sea_mask = datamask.eq(1).Not();

expanded_sea_mask = sea_mask.updateMask(sea_mask.focalMin(1000, units='meters'))

location = aoi.centroid().coordinates().getInfo()[::-1]


m = folium.Map(location=location, zoom_start=11)

m.add_ee_layer(sea_mask, {}, 'masked');
m.add_ee_layer(expanded_sea_mask.mask().gte(0.1), {}, 'maskExpand');

m.add_child(folium.LayerControl())


display(m)
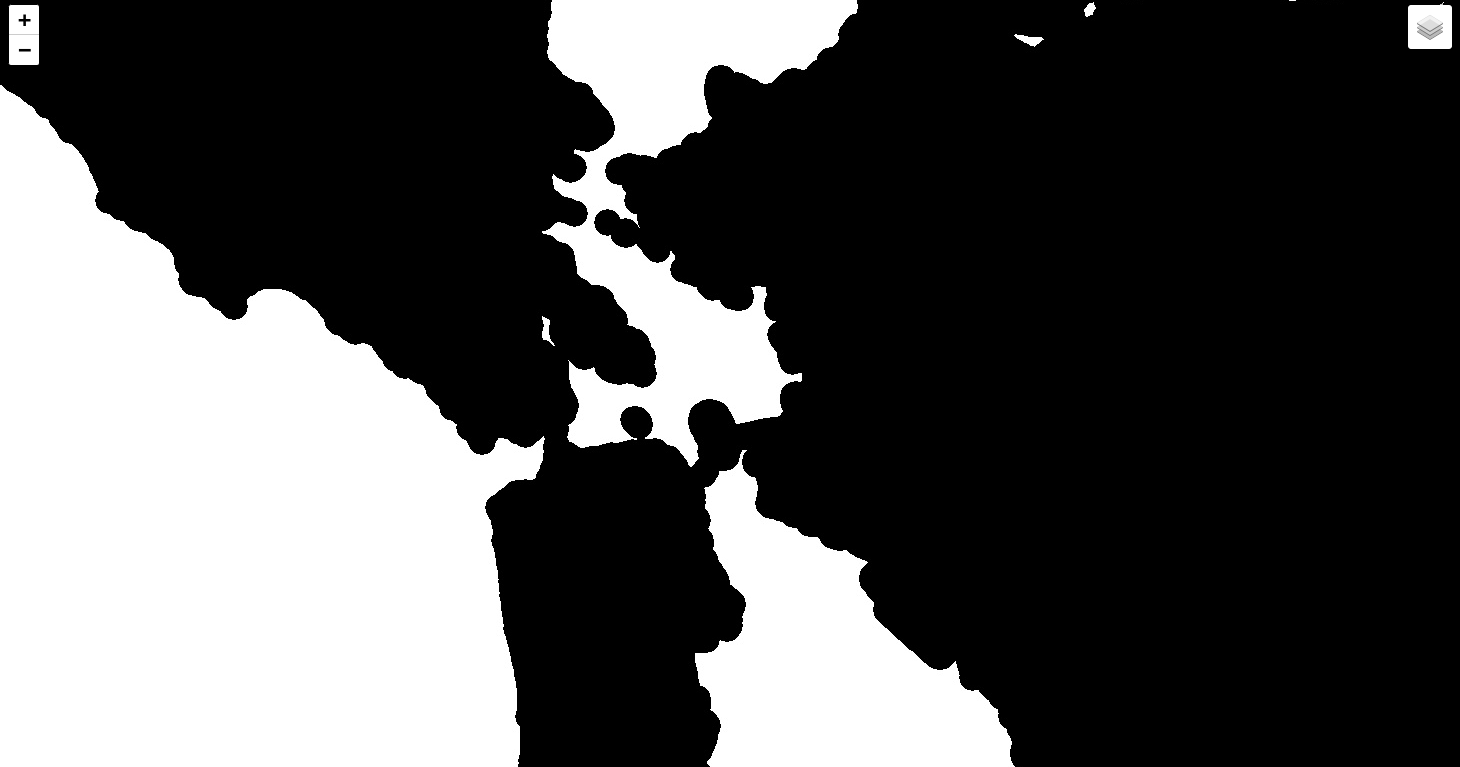
High detail coastlines
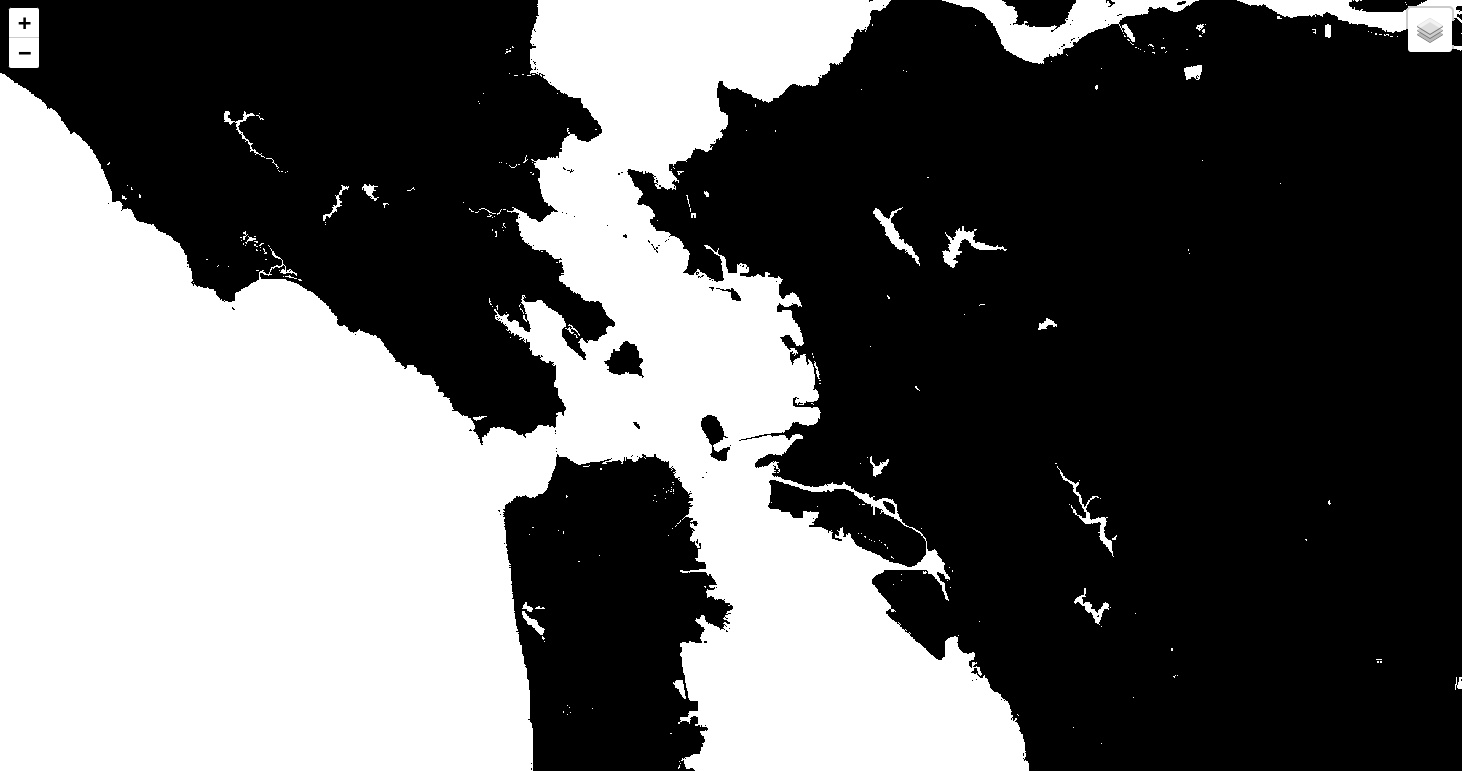
Coastlines after bloating
We can now start processing the satellite images, in order to extract the positions of the ships. The process works via the following steps:
Preprocess:
- Obtain the SAR images from Earth Engine
- Create the land using the masks described in the previous step
Process:
- Use a Gaussian blurring function to remove high-frequency noise from the image
- Remove the masked land
- Filter out areas that do not “glow” in the SAR image (Filter out the sea)
- Filter out patches of excessive size (accidental inclusion of land masses)
location = aoi.centroid().coordinates().getInfo()[::-1]
m = folium.Map(location=location, zoom_start=11)
# Make an RGB color composite image (VV,VH,VV/VH).
rgb = ee.Image.rgb(ffa_db.select('VV'),
ffa_db.select('VH'),
ffa_db.select('VV').divide(ffa_db.select('VH')))
m.add_ee_layer(rgb, {'min': [-20, -20, 0], 'max': [0, 0, 2]}, 'rgb')
#Sea filter ---------------
hansenImage = ee.Image('UMD/hansen/global_forest_change_2015').clip(aoi)
# Select the land/water mask.
datamask = hansenImage.select('datamask')
# Create a binary mask.
sea_mask = datamask.eq(1).Not()
# Warning coastal regions might get included
expanded_sea_mask = sea_mask.updateMask(sea_mask.focalMin(250, units='meters')).mask().clip(aoi)
# ============= START PROCESSING ===============
#Useful guide: https://developers.google.com/earth-engine/guides/image_objects
# 0. gaussian blur image
# Boxcar blur
boxcar = ee.Kernel.square(**{
'radius': 1
});
smoothRGB = rgb.convolve(boxcar)
# m.add_ee_layer(smoothRGB, {}, 'Smoothed') # <===============
# 1. Filter areas on land
# IDEA greater gaussian which maps out ships-> mask (issue: tiny islands)
def filterOnLand(image):
return image.updateMask(expanded_sea_mask)
filtered = filterOnLand(smoothRGB)
# m.add_ee_layer(filtered, None,name='Land filter') # <===============
# 2. filter out blue spots
def classifyOrange(image):
vv = image.select('vis-red')
blobs = vv.gt(-2)
blobs = blobs.updateMask(blobs).rename('blobs') #Remove all pixels equal to 0
return blobs #img.addBands(water)
#print(smoothRGB.getInfo())
classified = classifyOrange(filtered)
#m.add_ee_layer(classified.randomVisualizer(), None, name='Highlight red Blobs') # <===============
# 3. filter out too large patches
object_id = classified.connectedComponents(
connectedness=ee.Kernel.plus(1), maxSize=32)
#-------------------------- Get position of list of features
# https://developers.google.com/earth-engine/guides/reducers_reduce_to_vectors
reducedPatch = object_id.select('labels').reduceToVectors(
reducer=ee.Reducer.countEvery(), eightConnected=True, bestEffort=True) #fixme set scale?
#Create an empty image into which to paint the features, cast to byte.
empty = ee.Image().byte()
# Paint all the polygon edges with the same number and width, display.
outline = empty.paint(reducedPatch, 1, 3)
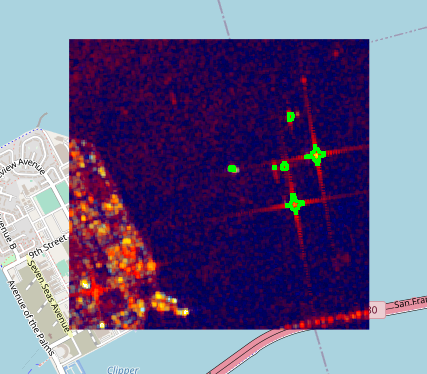
m.add_ee_layer(outline, {'palette': '00FF00'}, 'Highlight found and classified blobs')
# -------------------------------- Add a layer control panel to the map.
m.add_child(folium.LayerControl())
display(m)
We thus take the following SAR image
And after processing we obtain the blobs which represent the different ships